Remittance Cost Report 2026: What Migrants Really Pay to Send Money Home (Crypto vs Banks, by Corridor)
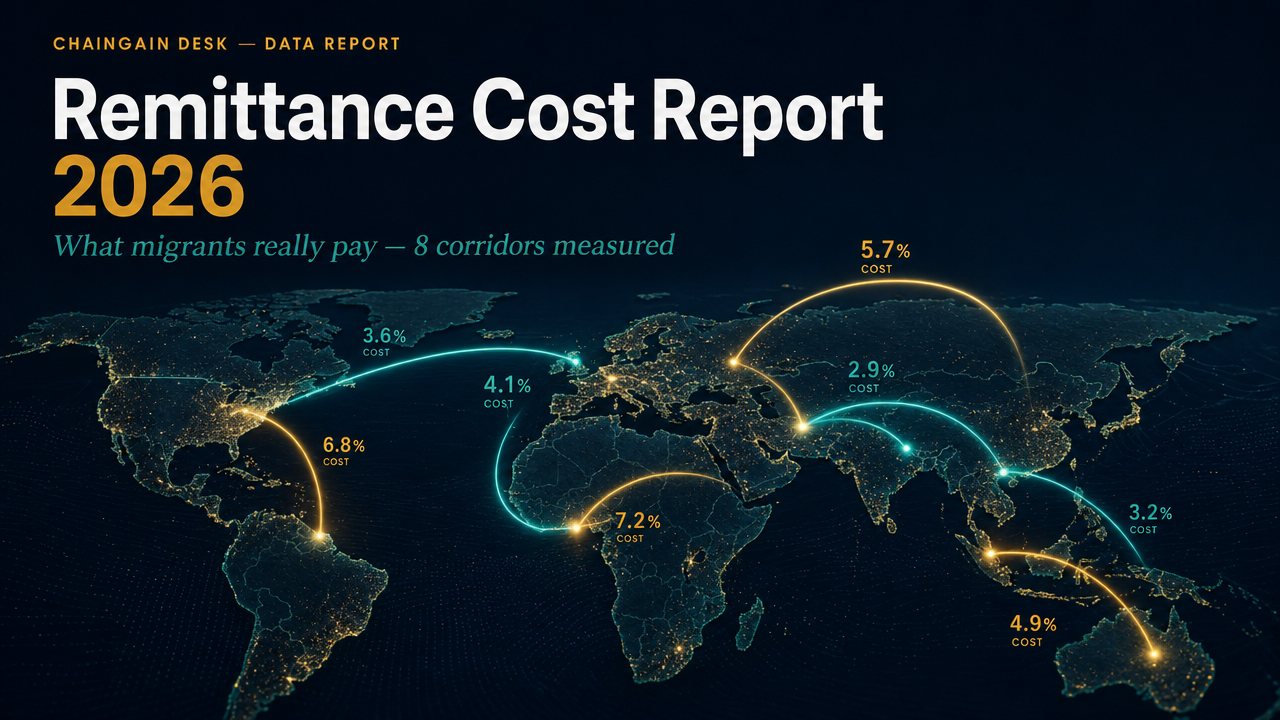
Remittance Cost Report 2026 is an independent, sourced comparison of what it actually costs to send money home across eight major corridors — putting crypto rails (USDT/USDC by network, plus the local off-ramp) side by side with traditional services (Western Union, MoneyGram, Wise, Remitly and banks). Unlike the World Bank’s Remittance Prices Worldwide, which covers only traditional providers, and crypto sites that quote only network fees, this report standardizes the all-in cost — network fee + on-ramp + off-ramp spread + FX — so the two worlds are finally comparable in one place.
The headline: on a $1,000 transfer, the model saves about $34 to Kenya and $30 to Brazil versus the average traditional service — but the Brazil figure is carried forward from May because no executable public P2P offer was observable on the Q3 review date. In some corridors the cheapest traditional option still wins.
Key Findings
- No universal winner: the cheapest way to send money depends on the corridor, the amount, and whether the recipient is banked.
- Q3 refresh scope: Mexico, Philippines, Kenya and Indonesia were re-quoted on 30 August 2026. Nigeria, Brazil, India and Ghana retain the May snapshot at LOW confidence because the public P2P search returned no executable offers at the modelled amounts.
- Crypto all-in cost: sending USDT on a low-fee network (Polygon/Solana) plus a local off-ramp costs under 1% in seven of the eight corridors at $200. Ghana is the exception (~3.9%) on cedi volatility.
- Traditional corridor average ($200, World Bank Q3 2025): Mexico 4.54%, Philippines ~3.3%, Nigeria 2.72%, Brazil 5.63%, India 3.68%, Kenya ~7%, Ghana ~8%, Indonesia ~4.5%.
- Biggest modelled savings ($1,000): Kenya ~$34 (Q3 refresh), Brazil ~$30 (May carry-forward), and Indonesia ~$22 (Q3 refresh) versus the average traditional service.
- But traditional can win: the single cheapest traditional option beats crypto in Nigeria (MoneyGram 0.01%) and roughly ties it in the Philippines (0.58%); promotional debit rates can go negative in Mexico and India.
- Speed: stablecoin transfers settle in seconds to minutes; bank-based services take 1–3 business days.
- Hidden costs: sending USDT on the wrong network can mean permanent loss; India may require tax withholding on a virtual digital asset transfer (see the India section); Ghana’s cedi volatility widens its off-ramp spread.

Methodology
This report compiles and standardizes publicly observable data. It does not invent measurements: every figure carries a source and a collection date, and the “original” contribution is the standardized, crypto-inclusive, corridor-level comparison — not fabricated transaction data.
- Sample amounts: $200 (the World Bank benchmark) and $1,000 (where crypto’s fixed costs amortize and it pulls ahead).
- Traditional baseline: World Bank Remittance Prices Worldwide, Q3 2025 (still the latest published issue at the 30 August 2026 review). Mexico, Philippines, Nigeria, Brazil and India use direct corridor figures; Kenya, Ghana and Indonesia use World Bank regional-average estimates (see Limitations).
- Crypto all-in model = 0.20% on-ramp assumption + modelled network/withdrawal fee + cash-out execution spread. For the Q3 refresh, the reference FX rate is Frankfurter’s blend of official-source rates and the cash-out proxy is the median of up to five best eligible public Binance P2P USDT SELL ads for the modelled amount.
- Fresh observations (30 August 2026): Mexico, Philippines, Kenya and Indonesia. The reference-rate observations are dated 29 August 2026; the public ads were collected the following day.
- Carry-forward rows: Nigeria, Brazil, India and Ghana retain the 29 May 2026 snapshot because no executable public SELL offers were returned. They are marked LOW confidence; absence of a public ad is not evidence of market-wide unavailability.
- Conservative floor: when the observed P2P quote is equal to or better than the reference FX rate, the calculation still applies a 0.30% execution-cost floor. USDC rows use the observed USDT cash-out quote as a proxy and are LOW confidence.
- Limitations: public P2P ads are indicative and may disappear before execution. Payment method, KYC, counterparty, provider, tax, deposit, withdrawal and slippage costs can differ. Kenya/Ghana/Indonesia traditional costs are regional-average estimates. Ghana and all carry-forward crypto rows are LOW confidence. India’s VDA withholding rules may create compliance or cash-flow effects, but withholding is not automatically a final 1% economic cost and is not added to this model.
- Update cadence: this is the 2026 edition; we refresh quarterly.
Master comparison: all-in cost by corridor
Lower is cheaper. “Traditional average” is the World Bank corridor mean; “cheapest traditional” is the single best-priced service in that corridor; “crypto” is the stated model, not a guaranteed transaction quote. Q3-refreshed and carried-forward rows are distinguished in the downloadable CSV.
| Corridor | Amount | Cheapest traditional | Traditional average | Crypto (USDT, Polygon) | Crypto (USDT, TRC-20) |
|---|---|---|---|---|---|
| US→Mexico | $200 | MoneyGram 1.71% | 4.54% | 0.50% | 0.75% |
| US→Philippines | $200 | MoneyGram 0.58% | 3.27% | 0.50% | 0.75% |
| US→Nigeria | $200 | MoneyGram 0.01% | 2.72% | 0.51% | 0.75% |
| US→Brazil | $200 | Bank of America 1.18% | 5.63% | 0.52% | 0.76% |
| US→India | $200 | Walmart2World -0.53%* | 3.68% | 0.51%** | 0.75%** |
| US→Kenya | $200 | Sendwave to M-Pesa 3.50% | 7.00% | 0.50% | 0.75% |
| US→Ghana | $200 | WorldRemit to MoMo 4.50% | 8.00% | 3.91% | 4.15% |
| US→Indonesia | $200 | Wise 1.50% | 4.50% | 0.52% | 0.77% |
| US→Mexico | $1,000 | MoneyGram 1.71% | 1.93% | 0.50% | 0.55% |
| US→Philippines | $1,000 | MoneyGram 0.58% | 1.95% | 0.50% | 0.55% |
| US→Nigeria | $1,000 | MoneyGram 0.01% | 0.93% | 0.50% | 0.55% |
| US→Brazil | $1,000 | Bank of America 1.18% | 3.51% | 0.51% | 0.56% |
| US→India | $1,000 | Walmart2World -0.53%* | 1.41% | 0.50%** | 0.55%** |
| US→Kenya | $1,000 | Sendwave to M-Pesa 3.50% | 3.90% | 0.50% | 0.55% |
| US→Ghana | $1,000 | WorldRemit to MoMo 4.50% | 4.50% | 3.90% | 3.95% |
| US→Indonesia | $1,000 | Wise 1.50% | 2.70% | 0.50% | 0.55% |

Against the average traditional service, the $1,000 modelled differences are about $14.31 (Mexico), $14.50 (Philippines), $4.26 (Nigeria), $29.98 (Brazil), $9 (India), $34 (Kenya), $22 (Indonesia) and $6 (Ghana). Nigeria, Brazil, India and Ghana are May carry-forwards. The US 1% federal remittance excise tax applies only to qualifying transfers funded with specified physical instruments such as cash, money orders or cashier’s checks; it is not included in these provider-cost rows.

Corridor deep dives
US → Mexico
The largest remittance corridor in the world. Traditional costs average 4.54% at $200, but promotional debit rates can be near zero on small amounts. The 30 August public P2P quote was better than the blended reference rate; the model therefore applies its conservative 0.30% execution floor, producing 0.50% for USDT on Polygon. This is a snapshot, not a guaranteed Bitso or bank payout quote.
US → Philippines
One of the world’s deepest crypto-fiat markets thanks to GCash and local bank/e-wallet routes. MoneyGram’s historical debit/online rate (0.58%) is competitive. The 30 August public P2P quote was better than the blended reference rate, so the model uses the 0.30% execution floor and returns 0.50% for USDT on Polygon. See our guide to the cheapest way to send money to the Philippines.
US → Nigeria
The standout finding: after the 2024 naira float, the official rate (~₦1,374) and the parallel/P2P rate (~₦1,378–1,390) have converged, collapsing the old “USDT premium” of 2–5% down to roughly 0.3%. Crypto now beats the corridor average (2.72%) — but MoneyGram’s debit/online rate of 0.01% is still the single cheapest option. Crypto wins on speed and for the unbanked. More in our Nigeria remittance guide.
US → Brazil
Where crypto’s advantage is largest among banked recipients. Traditional costs are driven up by a high average FX margin (~3%), averaging 5.63% at $200. Stablecoins settled to a PIX key cost about 0.52% all-in and arrive in seconds, saving roughly $30 on $1,000. See how to send money to Brazil with PIX and USDT. Off-ramp spread: ~0.31%.
US → India
For a $200 transfer, the table retains a 0.51% modelled crypto cost from May 2026, at LOW confidence, alongside the World Bank Q3 2025 traditional corridor average of 3.68%. These are historical comparisons, not current executable quotes. Tax deducted at source (TDS) is withholding, not automatically an extra final 1-percentage-point fee. It can affect the cash available at settlement. The Income Tax Department explains how TDS credits are handled and that tax paid above the actual liability can be refunded. Applicability, reporting, credit and any refund depend on the transaction and taxpayer. This model excludes those individual tax effects; it does not add 1% to produce a 1.5% final cost.
US → Kenya
Against a ~7% corridor average, the refreshed model returns 0.50% for USDT on Polygon and a $34 difference on $1,000. The observed public P2P quote was slightly better than the blended reference rate, so the 0.30% execution floor applies. Actual M-Pesa or bank payout availability, provider fees and counterparty limits must be checked. See our coverage of M-Pesa and USDT in Kenya and the broader crypto remittances to Africa guide.
US → Ghana
The honest counter-example. While the traditional corridor average is high (~8%), Ghana’s crypto off-ramp is also costly — cedi volatility and thinner liquidity push the USDT-to-MoMo spread to ~3.7%, so crypto all-in (~3.91%) only modestly beats the cheapest traditional option (WorldRemit to MoMo ~4.5%). Crypto is not a clear winner in every market. More in our Africa remittances guide. (Low confidence, single-source; under review for the next edition.)
US → Indonesia
Against a ~4.5% corridor average, the refreshed model returns 0.52% at $200 and 0.50% at $1,000 for USDT on Polygon, a difference of about $22 versus the average at $1,000. The observed spread was 0.32% for the $200 executable-ad set and 0.21% for $1,000, where the 0.30% floor applies. Actual bank/e-wallet payout costs can differ.
How crypto rails work: stablecoins by network
The all-in cost of a crypto remittance is dominated by the off-ramp spread and the network fee. Network choice matters enormously:
- Solana, Stellar, Polygon: fees well under one cent — effectively free at any transfer size.
- TRON (TRC-20): the most popular rail for USDT, ~$0.20–1.00 — cheap on $1,000, noticeable on $200.
- Ethereum (ERC-20): ~$3.40 — avoid for remittances.
For the full network-by-network breakdown see the best blockchain for sending money, and for the stablecoin choice itself, USDT vs USDC for remittances. For the full traditional picture, see our remittance cost guide and Wise vs crypto comparison.
The hidden costs
- P2P / cash-out spread: the gap between the executable USDT quote and reference FX. It changes with amount, limits, payment method and counterparty. Ghana’s ~3.7% figure is a LOW-confidence May carry-forward, not a current market-wide quote.
- FX margin: the largest hidden cost in traditional transfers — nearly 3% on US→Brazil.
- Tax and withholding: India’s VDA transfer rules can require withholding and reporting, but withholding is not automatically the sender’s final economic cost. The US 1% remittance excise applies to qualifying transfers funded with specified physical instruments. Neither item is added to the model.
- Wrong-network loss: the single most damaging crypto mistake. Sending USDT on a network the recipient cannot receive — or to an incompatible chain — can result in permanent, unrecoverable loss, with no bank to reverse it. Always confirm the network (TRC-20 vs ERC-20 vs Polygon) before sending. (Source: MetaMask and major-exchange support documentation.)
Which method is right for you?
- Small amounts ($200) to a banked recipient: the cheapest traditional digital option (often MoneyGram debit/online) is hard to beat — sometimes cheaper than crypto.
- Larger amounts ($1,000+): stablecoins pull clearly ahead as fixed network fees amortize.
- Recurring transfers: crypto’s low marginal cost and speed compound over time.
- Unbanked recipient: crypto to a mobile wallet (GCash, M-Pesa, PIX key) needs no bank account.
- Speed-critical: crypto settles in seconds-to-minutes versus 1–3 days for bank rails.
- Exception — Ghana: thin crypto liquidity means traditional and crypto are close; compare live before sending.
Limitations and updates
The traditional baseline remains World Bank RPW Q3 2025, still the latest issue at the 30 August 2026 review. Mexico, Philippines, Nigeria, Brazil and India use direct corridor figures; Kenya, Ghana and Indonesia use regional-average estimates. Crypto rows for Mexico, Philippines, Kenya and Indonesia were refreshed on 30 August. Nigeria, Brazil, India and Ghana retain the May snapshot at LOW confidence because no executable public offers were returned. Public ads are indicative and can disappear before execution; KYC, provider availability, payment method, counterparty, tax, deposit, withdrawal and slippage are outside this model. This is the 2026Q3 dataset version.
Cite this report
Suggested dataset citation: Apex Digital Media LLC. (2026). Remittance Cost Report 2026: Crypto vs Traditional Remittance Costs by Corridor (Version 2026Q3) [Data set]. Zenodo. https://doi.org/10.5281/zenodo.22168494
Zenodo record: 10.5281/zenodo.20781804 (all versions) · 10.5281/zenodo.22168494 (2026Q3).
Download the dataset: the full corridor × method table is available as a CSV: remittance-cost-report-2026.csv. Free to reuse with attribution under CC BY 4.0. Charts may be embedded with a link back to this report.
Dataset updated: 30 August 2026 (2026Q3 dataset). Editorial correction: 5 September 2026 — clarified India withholding without changing the dataset figures. Next scheduled data review: Q4 2026.
Frequently Asked Questions
What is the cheapest way to send money home in 2026?
It depends on the corridor and amount. For small transfers to a banked recipient, the cheapest traditional digital service (often MoneyGram debit/online) can cost under 1%. For larger amounts, high-cost corridors (Kenya, Brazil), or unbanked recipients, stablecoins (USDT/USDC on a low-fee network) are cheapest at roughly 0.5–0.8% all-in and settle in seconds.
Is crypto always cheaper than Western Union or banks?
No. Crypto’s clearest advantages are large amounts, high-cost corridors, speed, and unbanked recipients.
How much does it cost to send $1,000 with crypto?
About $5–8 all-in using USDT on a low-fee network plus a local off-ramp, versus a traditional corridor average of roughly $9 (Nigeria) to $45 (Ghana) for the same amount.
What is the biggest risk when sending crypto abroad?
Sending on the wrong network. If you send USDT on a chain the recipient cannot receive, or to an incompatible blockchain, the funds can be permanently lost. Always confirm the network before sending.
How current is this data?
Traditional costs use World Bank RPW Q3 2025, still the latest issue at the 30 August 2026 review. Mexico, Philippines, Kenya and Indonesia were refreshed on 30 August; Nigeria, Brazil, India and Ghana retain the May crypto snapshot at LOW confidence. The report is reviewed quarterly.

Editorial pen name · ChainGain
Alex Mercer is the editorial pen name used for ChainGain’s cryptocurrency education content. Articles are based on cited sources and reproducible comparisons. Editorial profile