Crypto Risk Management 2026: Position Sizing, Stop-Loss & R-Multiples for Beginners
Table of Contents
Affiliate disclosure: This is an educational guide about risk methodology. No exchange or product is recommended below. The math here works on any platform; choose your venue based on liquidity and security, not on what you read in a guide.
Most beginners don’t blow up their crypto account because they pick the wrong coin. They blow up because their position size is wrong before the trade even starts. A trader who picks losers 60% of the time can stay profitable. A trader who risks 10% per trade can pick winners 70% of the time and still hit zero in a bad month. This guide is the math that separates one outcome from the other — built around the 1% rule, three position-sizing methods you can compute in 60 seconds, the four stop-loss types and when each fits, and the R-multiple expectancy framework that lets you measure whether your strategy actually has an edge.
By the end you will have a pre-trade checklist that costs nothing, a position-sizing formula you can apply on any pair, an honest expectancy table to benchmark your own results, and a journal methodology that compounds skill over months. We pick up where our order types guide and order book reading guide stopped — execution skill is necessary but not sufficient without the risk math underneath it.
Key Takeaways
- The 1% Rule (single non-negotiable): Never risk more than 1% of total capital on any single trade — applies to every strategy, every market, every timeframe.
- Position sizing formula: (Capital × 1%) ÷ (Entry price − Stop Loss price) = position size in units.
- Stop-loss hierarchy: Hard stops (exchange-side) > mental stops > trailing stops. Volatility regime determines which fits.
- R-multiples mindset: Profit = +2R to +3R per winner, loss = -1R; with 1:2 reward/risk, you need only 33-40% win rate to break even.
- Drawdown asymmetry kills accounts: -20% requires +25% recovery; -50% requires +100%; -75% requires +300%. Risk control is mathematical survival.
- Altcoin “diversification” trap: BTC correlation often exceeds 0.85 in altcoins — your “diversified portfolio” is concentrated risk in disguise.
- Trading journal = edge accumulator: Track entry reason, exit reason, R-multiple, and emotional state per trade — pattern emerges within 50-100 trades.
Why Most Beginners Blow Up: The Math Reality
TLDR: Across ESMA-mandated CFD broker disclosures under MiFID II, 70-85% of retail traders lose money in any given quarter — and the cause is rarely strategy, it is under-reserving capital against losses. The arithmetic is unforgiving: risking 10% per trade through ten consecutive losses leaves you at 0.90^10 ≈ 34.9% of capital, requiring a 187% gain to recover, whereas 1% risk leaves 0.99^10 ≈ 90.4%, a 10.6% recovery that takes weeks. Loss is asymmetric — a 50% loss needs a 100% gain back, an 80% loss needs 400% — so compounding works against you twice as hard on the way down. Three numbers anchor everything: the percentage you risk per trade, your entry-to-stop distance, and your strategy’s expected R-multiple.
The single most quoted statistic in retail trading — “70-85% of traders lose money over any given quarter” — has been confirmed across multiple ESMA-mandated CFD broker disclosures under MiFID II, where every regulated EU broker is required to publish the percentage of retail accounts that lose money. The cause is rarely lack of strategy. It is structural under-reservation of capital against losses. A trader who risks 10% of equity per trade and runs into ten consecutive losses (improbable but not absurd at any honest win rate) is left with 0.90^10 ≈ 34.9% of starting capital — a drawdown that requires a 187% gain to recover. The same trader at 1% risk is left with 0.99^10 ≈ 90.4% of capital, a 10.6% recovery requirement that takes weeks rather than years.
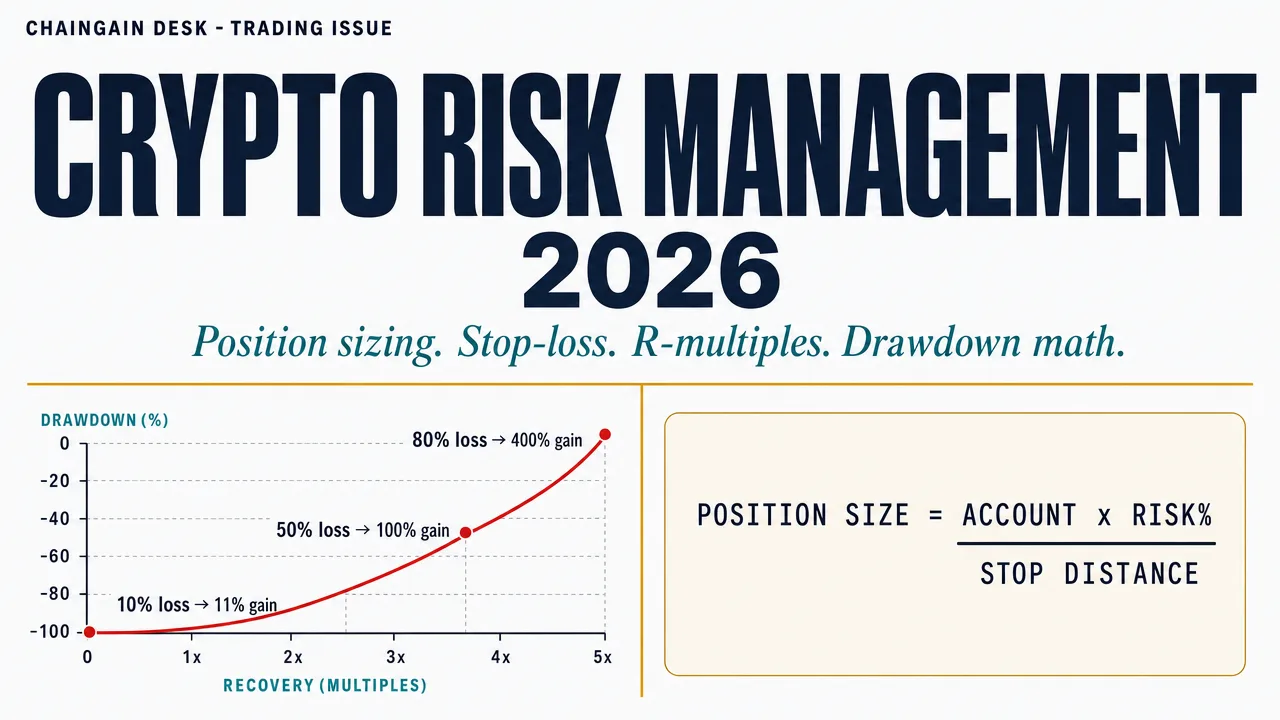
The hidden enemy is asymmetry. A 50% loss requires a 100% gain to recover. An 80% loss requires a 400% gain. Compounding works against you on the way down twice as hard as it works for you on the way up. This is not a behavioral observation; it is arithmetic. Once you internalize that arithmetic, every other risk rule in this guide becomes obvious instead of arbitrary.
Three numbers anchor everything that follows: the percentage of equity you risk per trade, the distance between your entry and your stop, and the expected R-multiple of the strategy you are running. Get those three right and the rest is execution. Get them wrong and no entry technique, no chart pattern, and no AI signal will save you over enough trades.
💡 Before you pick an exchange, compare the real all-in cost (trading, spread, funding and withdrawal) with our free Crypto Exchange Fee Calculator — no-KYC and major venues, no signup.
The 1% Rule: Why Risking Less Wins More
TLDR: The 1% rule means risking no more than 1% of total equity per trade — where ‘risk’ is the dollar loss if your stop triggers, not the position size; on a $5,000 account that caps loss at $50 per trade. The reason 1% beats 2% or 5% is survival math: at 1% risk it would take roughly 69 consecutive losses to halve an account (statistically near-impossible at any real win rate), while 5% risk through twenty losses leaves just 0.95^20 ≈ 35.8% of capital, demanding a 179% recovery. Professionals run 0.5-1% until they have shown at least 12 months of consistent profitability — treat 1% as a hard ceiling for your first year, because the upside you forgo is dwarfed by the survival you buy.
The 1% rule states that you risk no more than 1% of total trading equity on any single trade. The “risk” here is not the position size — it is the dollar amount you would lose if the stop-loss triggers. On a $5,000 account, 1% risk means you can lose at most $50 per trade. The position itself can be larger, smaller, or matched depending on stop distance.
The math behind why 1% is the durable choice rather than 2% or 5% is straightforward. Each 1% loss reduces equity to 99% of its prior level. After 50 consecutive losing trades — a streak that should never happen with any reasonable strategy — equity is at 0.99^50 ≈ 60.5% of the starting balance. To halve the account, you would need approximately 69 consecutive losses (since log(0.5) / log(0.99) ≈ 68.97). At a realistic 50% win rate, the probability of 69 consecutive losses is so small that even at one trade per day you would expect to wait longer than the age of the universe to encounter it.
Compare this with 5% risk per trade. Twenty consecutive losses reduce equity to 0.95^20 ≈ 35.8% of starting capital. That recovery requires a 179% gain — multi-month at best, and only if the same strategy that just lost twenty trades suddenly starts winning. Twenty consecutive losses at a 50% win rate is rare but not absurd; over five years of active trading you will encounter it. The 1% rule survives this; the 5% rule does not.
Professional traders typically run between 0.5% and 1% per trade until they demonstrate at least 12 months of consistent profitability. Only then does scaling to 1.5-2% make defensible sense, and only on the strategies that have proven their expectancy. Treat 1% as a hard ceiling for your first year. The cushion you give up in winning trades is dwarfed by the survival you buy.
Position Sizing: The Pre-Trade Formula (Three Methods)
TLDR: Position sizing converts ‘I will risk 1% of my account’ into an actual order size through one core formula: Position Size = (Account Size × Risk%) ÷ Stop Distance — so a $5,000 account at 1% risk with a 5% stop buys $1,000 of the asset and loses exactly $50 if stopped. The order is fixed: decide stop placement from chart structure first, then calculate size — never shrink the stop to fit a position you already picked. Three methods extend the formula: Fixed % (the beginner default), Volatility-adjusted (stop = 1.5-2× the 14-day ATR; BTC’s ATR runs roughly $2,800-3,000 near $100K), and Fractional Kelly (1/4 Kelly, only once you have 100+ trades of measured expectancy).
Position sizing is the calculation that converts “I will risk 1% of my account” into “I will buy X coins of Y at price Z.” There is one core formula that every other method extends:
Position Size = (Account Size × Risk%) ÷ Stop Distance
Example: $5,000 account, 1% risk, 5% stop distance from entry to stop-loss. Position size = ($5,000 × 0.01) ÷ 0.05 = $1,000. You buy $1,000 of the asset; if the stop triggers at -5%, you lose $50, which is exactly 1% of the account.
The formula always runs in this order: account size first, risk percentage second, stop distance third. You never adjust the stop to fit a position size you have already decided on — that is the most common reversal of cause and effect in retail trading and the reason most “tight stops” get hit on noise. Decide stop placement from the chart structure, then calculate position size from the math. Three methods extend the core formula:
| Method | How it sizes | Best for | Trade-off |
|---|---|---|---|
| Fixed % (1% rule) | Always risk 1% of equity, position size scales inverse to stop distance | Beginners and any account that hasn’t yet established expectancy | Ignores volatility regime — same 1% on quiet days and chaos days |
| Volatility-adjusted (ATR-based) | Stop distance = 1.5-2× the 14-day ATR of the asset; position size scales accordingly | Multi-asset traders, anyone trading both BTC and altcoins | Requires tracking ATR; some platforms hide it |
| Fractional Kelly (1/4 Kelly) | Optimal sizing from Kelly criterion (f* = [p × (1+b) − 1] / b, where p is your historical win rate and b is your average winner divided by your average loser), then divide by 4 for safety | Traders with 100+ trades of measured expectancy data | Full Kelly is too aggressive for crypto; needs accurate p and b inputs |
The volatility-adjusted method matters because Bitcoin’s 14-day ATR in 2026 has run between roughly $2,000 and $3,000 depending on the price level — when BTC is near $100K, ATR clusters around $2,800-3,000. A flat 5% stop on BTC is wildly different from a 5% stop on a small-cap altcoin whose ATR may be 8% or more. The ATR-based stop tracks the volatility the asset is actually exhibiting and prevents premature triggers on noise. TradingView’s ATR(14) indicator is free and available on every major pair.
Fractional Kelly is for later. The full Kelly formula maximizes long-run growth assuming you know win probability (p) and odds (b) precisely — and crypto traders never know these precisely on a forward-looking basis. CoinMarketCap’s analysis of Kelly in crypto recommends running 1/4 Kelly (one quarter of what full Kelly suggests) to absorb estimation error. If full Kelly says “size at 8% per trade,” 1/4 Kelly says 2% — still aggressive by 1%-rule standards but mathematically defensible if your expectancy is well-measured.

Stop-Loss Types: Picking the Right Tool for the Volatility Regime
TLDR: The stop-loss enforces your position-sizing math — if it never triggers because you moved or skipped it, your ‘1% risk’ is fictional. Four types fit different regimes: a hard server-side stop (the default, because it survives sleep, travel, and exchange outages), a trailing stop (trend-following with profit protection, but whipsawed in choppy ranges), a mental stop (almost never for beginners — discipline fails over 70% of the time), and a time-based stop (mean-reversion windows). Place the stop just beyond meaningful structure — below a swing low or past 1.5× the 14-day ATR — never a flat ‘2% below entry’, which all but guarantees being stopped out by noise.
The stop-loss is the mechanism that enforces your position size math. If the stop never triggers — because you moved it, removed it, or never set one — your “1% risk” calculation is fictional. Four stop-loss types exist on most exchanges, and each fits a different volatility regime and conviction level. The decision matrix below is the framework I use to pick one before opening a trade rather than after.
| Type | How it works | Use when | Avoid when |
|---|---|---|---|
| Hard stop (server-side) | Limit or market order resting on the exchange that triggers automatically | Default. You sleep, you travel, exchange goes down — your stop still exists | Pair has thin liquidity below the stop (slippage on trigger) |
| Trailing stop | Stop moves up (long) or down (short) by a percentage as price moves favorably | Trend-following with profit protection; volatility expanding | Choppy ranging markets — gets dragged out on whipsaws |
| Mental stop | Trader observes a price level and exits manually if breached | Extreme rare-edge scenarios; when known liquidity hunts target server-side stops | Almost never for beginners — discipline failure rate is 70%+ |
| Time-based stop | Exit if trade hasn’t moved in your favor by N hours/days | Mean-reversion or news-driven trades with a thesis time window | Trend-following — cuts winners early |
Stop placement is the second decision and it is structural, not arbitrary. The wrong placement is “exactly 2% below entry regardless of chart” — that virtually guarantees being stopped out by normal noise. The right placement is just beyond the nearest meaningful structure: below a swing low, below a daily support level, or beyond 1.5× the 14-day ATR. Look at the chart, find the level that, if breached, invalidates your trade thesis, and place the stop slightly past it. Then calculate position size from that distance.
Two execution warnings matter. First, on illiquid pairs your stop may slip — the trigger price and fill price can differ by several percent. Always check the depth chart at the stop level before sizing (our order book guide covers this). Second, “stop hunts” are real on certain exchanges and pairs — large players sometimes push price through obvious cluster levels to trigger retail stops. Placing your stop a few percent below the obvious level (rather than exactly at it) reduces hunt vulnerability without changing your invalidation logic.
R-Multiples: The Math That Measures Edge
TLDR: R-multiples, popularised by Van K. Tharp, measure whether your strategy actually has an edge: R is the amount you risked, so a $50 risk makes a $100 winner +2R and a stop-out -1R, which normalises results across position sizes. The one equation that matters is expectancy = (Win Rate × Avg Win in R) − (Loss Rate × 1); a 50% win rate with +1.5R winners and -1R losers yields +0.25R per trade, or about +$1,250 over 100 trades risking $50 each. The trap is that a high win rate alone is meaningless — a 60%-winning scalper averaging +0.6R against -1R losers is quietly negative at -0.04R once fees bite. Track real expectancy after 30 trades; below +0.1R, the strategy needs a structural change, not more conviction.
Once your position sizing and stops are disciplined, the next question is whether your strategy actually has an edge. The framework that answers this is R-multiples, popularized by Van K. Tharp in Trade Your Way to Financial Freedom. R is shorthand for the dollar amount you risked on a trade. If you risked $50, then 1R = $50. A trade that gains $100 is +2R. A trade that hits the stop at -$50 is -1R.
Why use R instead of dollars? Because R normalizes across position sizes. A $1,000 winner from a $50 risk is +20R; a $5,000 winner from a $1,000 risk is +5R. The first is a far better outcome relative to capital deployed. R-multiples let you compare trades, strategies, and traders on a common scale. The single equation that summarizes whether you have an edge is expectancy:
Expectancy (R per trade) = (Win Rate × Avg Win in R) − (Loss Rate × 1)
Example: 50% win rate, average winner is +1.5R, average loser is -1R. Expectancy = (0.50 × 1.5) − (0.50 × 1) = 0.75 − 0.50 = +0.25R per trade. Over 100 trades risking $50 each, expected gain is 0.25 × 100 × $50 = +$1,250.
Positive expectancy is the only thing that matters long-term. Everything else — the win rate, the average winner size, the streaks — is just decomposition of expectancy. The four scenarios below illustrate how the same risk math plays out across very different strategy types and psychological profiles, including two that look profitable but are quietly negative. Knowing which profile fits you matters more than chasing the highest win rate.
| Profile | Win Rate | Avg Win (R) | Avg Loss (R) | Expectancy | Psychological match |
|---|---|---|---|---|---|
| Trend-rider | 40% | +3R | -1R | +0.6R | Comfortable losing 6 of 10; patient on home runs |
| Balanced swing | 50% | +1.5R | -1R | +0.25R | Wins and losses roughly equal; steady drumbeat |
| Scalper | 60% | +0.6R | -1R | -0.04R ⚠️ | Looks profitable; secretly negative once fees and slippage erode the small winners |
| Mean-reversion | 70% | +0.4R | -1R | -0.02R ⚠️ | Feels great (lots of wins); the 30% losses at full -1R still net negative |
The brutal truth this table reveals: high win rate alone is meaningless. A 70%-winning strategy whose winners average only 0.4R while losers stay at -1R bleeds capital, even though six in ten trades feel good. Most beginners gravitate toward high-win-rate strategies because they feel better — but feeling better is not the same as making money. Track your actual expectancy after 30 trades. If it is below +0.1R, your strategy needs a structural change, not more conviction.
Drawdown Recovery: The Asymmetry That Kills Accounts
TLDR: Drawdown recovery is exact and brutal arithmetic: Required Gain = Loss ÷ (1 − Loss), so a 20% drawdown needs a 25% gain, a 50% drawdown needs 100%, and an 80% drawdown needs a statistically unrecoverable 400%. The asymmetry compounds non-linearly as losses deepen, which is the entire reason the 1% rule exists — to keep you out of the bottom rows where recovery math becomes punishing. A practical safeguard follows directly: set a personal circuit breaker that stops trading once the account falls 15% from its peak, review every journal entry to separate strategy failure from execution failure from variance, then halve position sizes until you are back within 5% of the peak.
Every loss requires a disproportionately larger gain to recover. This is not a metaphor or a behavioral claim — it is arithmetic. The formula is exact and brutal:
Required Gain to Recover = Loss ÷ (1 − Loss)
A 20% drawdown is not erased by a 20% gain. It is erased by a 25% gain (0.20 ÷ 0.80 = 0.25). A 50% drawdown requires a 100% gain. The asymmetry compounds non-linearly as losses deepen.
| Drawdown | Required gain to recover | Severity | What it demands |
|---|---|---|---|
| 10% | 11.1% | Routine | Happens to everyone; recoverable in weeks at positive expectancy |
| 20% | 25% | Material | Painful but recoverable; reassess strategy assumptions before trading more size |
| 30% | 42.9% | Serious | Demands a full strategy review and reduced sizing during recovery |
| 50% | 100% | Career-threatening | Rebuild from minimum size; assume the strategy you ran is no longer the one to use |
| 80% | 400% | Statistically unrecoverable | Most traders never recover; the math required exceeds any realistic compounding window |
The implication for risk management is structural. The 1% rule is not arbitrary; it is the dose that keeps you out of the recovery zones where the math becomes punishing. A streak of twenty consecutive losses at 5% risk — possible over five years of active trading — reduces equity to 0.95^20 ≈ 35.8% of starting capital and requires roughly 179% to break even. There is no honest return strategy that produces +179% reliably. The same streak at 1% risk leaves equity at 0.99^20 ≈ 81.8%, a 22% drawdown that compounds back over months rather than years.

One protective practice flows from this table: set a maximum drawdown circuit breaker for yourself. If the account drops 15% from its peak, stop trading. Review every trade in your journal. Identify whether the losses came from strategy failure (the edge is gone), execution failure (the strategy works but you didn’t follow it), or variance (you ran the strategy correctly and got unlucky). Then reduce position sizes by half until you are back to within 5% of peak. I have personally used this 15% circuit breaker rule for over five years; the one season I broke it cost me more than the prior twenty losing trades combined. This single rule prevents most catastrophic blowups.
The Hidden Correlation Risk in Altcoin “Diversification”
TLDR: Holding ten altcoins is not diversification — it is a correlation illusion. Altcoins show Bitcoin-correlation coefficients between 0.7 and 0.95 in stressed periods, so when BTC drops 20% a ‘diversified’ alt basket typically falls 25-40%, and during the 2022 LUNA collapse, the 2023 SVB-USDC depeg, and 2024 ETF-outflow events those correlations converged to near 1.0 — exactly when you needed protection. Real diversification happens at the asset-class level: hold meaningful stablecoin reserves (30-50% in USDT, USDC, or a mix during uncertain regimes, whose correlation to BTC drawdowns is near zero), spread across genuinely uncorrelated classes like equities or bonds, and if you must hold alts, pick different narrative buckets rather than ten of the same kind.
“I’m diversified — I hold ten different altcoins” is one of the most common and most dangerous risk illusions in crypto. In traditional finance, holding ten uncorrelated assets reduces portfolio variance roughly proportionally to the square root of the number of assets. In crypto, this almost never works because altcoins exhibit Bitcoin-correlation coefficients between 0.7 and 0.95 during stressed periods — meaning when BTC drops 20%, your “diversified” altcoin basket typically drops 25-40%, often more.
The correlation is not constant. During calm bull markets, altcoins decouple slightly and individual narratives drive returns. During corrections, panics, and exchange shocks, correlations converge to near 1.0. The 2022 LUNA collapse, the 2023 SVB-USDC depeg weekend, and the 2024 spot ETF outflow events all produced near-perfect altcoin correlation to BTC’s downward move. The diversification you thought you had vanished exactly when you needed it. For a deeper analysis, see our choosing between USDT and USDC.
Three structural moves provide actual diversification rather than the cosmetic kind. First, hold meaningful stablecoin reserves — 30-50% in USDT, USDC, or a mix during uncertain regimes. Stablecoins are not zero risk (we covered freeze and depeg scenarios in our USDT freeze guide) but their correlation to BTC drawdowns is near zero. Second, diversify across asset classes, not within altcoins — equities, real estate, gold, or government bonds genuinely uncorrelate from crypto on multi-month windows. Third, if you must hold multiple alts, choose ones from different narrative buckets (L1, DeFi, gaming, AI, RWA) rather than ten of the same kind.
None of this eliminates correlation risk — it dampens it. The honest framing is that crypto is one large bet on a single asset class, and your real diversification happens at the asset-class level, not at the token level. Acknowledging this prevents the false confidence that wrecks portfolios when BTC corrects 30% and the “diversified” alt basket corrects 50%.
The Trading Journal: How Edge Compounds
TLDR: Risk math without measurement is theater — the trading journal is what turns the formulas into compounding skill, because without it you cannot compute your real win rate, average winner, average loser, or expectancy, and so cannot tell edge from luck. A useful entry has eight fields capturable in under sixty seconds: date and pair; entry, stop, and target prices; position size and dollar risk; setup name; outcome in R and P&L; exit reason; a one-sentence lesson; and entry/exit screenshots. After 30 trades, compute two things — expectancy (does the strategy have an edge) and a discipline score (the percent of trades you sized and stopped as planned), because positive expectancy ruined by sloppy execution looks identical to no edge at all. Free spreadsheets work; tools like TraderSync (~$29/month) or Edgewonk (~€170 one-time) only add automation.
Risk math without measurement is theater. The trading journal is the instrument that turns the math into compounding skill. Without a journal you cannot compute your actual win rate, your average winner, your average loser, or your expectancy — which means you cannot tell whether you have an edge or whether you are running on luck. Most beginners skip this step. It is the highest-leverage habit in trading.
A useful journal entry has eight fields, each capturable in under sixty seconds:
- Date and pair — for filtering by month and asset
- Entry price, stop price, target price — defines the trade’s R
- Position size and dollar risk (R) — verifies sizing discipline
- Setup name — the strategy or pattern triggering the entry
- Outcome (price, R-multiple, dollar P&L) — the result
- Exit reason — stop hit, target hit, manual exit, time stop
- Mistake or lesson — one sentence, even on winners
- Screenshot of entry and exit — for later pattern review
After 30 trades, two computations matter. Compute expectancy: (Win Rate × Avg Winner R) − (Loss Rate × 1). This tells you whether your strategy has an edge as you run it. Compute “discipline score”: the percent of trades where you sized correctly, used the planned stop, and didn’t move the stop. This tells you whether your edge — if you have one — is being executed cleanly. A positive expectancy that you ruin with poor execution looks identical to no edge at all.
Free spreadsheet templates work fine; paid tools like TraderSync (~$29/month) or Edgewonk (~€170 one-time) add automation but are not required to start. In my own first 90 days of journaling, the single most revealing field was “exit reason” — comparing the times I took the planned exit versus the times I improvised showed me which mistakes were strategic and which were emotional, far faster than any P&L curve could. The first 90 days of journaling is the most valuable trading education you can give yourself, and it costs nothing except sixty seconds per trade.
Common Risk Management Mistakes Beginners Make
TLDR: The common beginner mistakes are predictable failure patterns, not opinions. Sizing the position before choosing the stop reverses cause and effect and produces tight stops that get hit on noise — always set the stop from chart structure, then size from the math. Widening a stop as price approaches it (‘it will turn around’) is the most expensive sentence in trading; move stops only toward profit, never away. Other recurring errors: having no predefined exit on winners, risking different amounts based on uncalibrated ‘conviction’, increasing size after winning streaks (the next 100 trades are statistically identical to the last), decreasing size after losses when expectancy is still positive (which only delays recovery), and mixing capital across strategies so performance can never be attributed.
The mistakes below are not opinions; they are the failure patterns that show up over and over in regulatory disclosure data and prop-firm dropout statistics. None of them are exotic. All of them are easily fixable once recognized.
- Sizing position first, choosing stop second. The cause-and-effect reversal that produces tight stops on noise. Always pick the stop from chart structure, then size the position from the math.
- Moving the stop wider when price approaches it. “It will turn around” is the most expensive sentence in trading. Move the stop in your favor (toward profit) or accept the loss; never widen.
- No predefined exit on winners. Half the trades that move into profit never get realized because the trader has no plan for taking gains. Pick a target or a trailing rule before entering.
- Risking different amounts per trade based on conviction. Conviction is uncalibrated; your “high conviction” trades have the same expectancy as your normal ones over enough samples. Risk the same R every time.
- Increasing size after winning streaks. The 100 trades after a 5-win streak are statistically identical to the 100 before it. Streaks feel meaningful; they aren’t.
- Decreasing size after losses. If your strategy has positive expectancy, reducing size during drawdown only delays recovery. Recompute expectancy honestly; if it’s positive, hold size and trust the math.
- Mixing capital between strategies. If you’re testing a new strategy, allocate a separate sub-account. Mixing makes performance attribution impossible.
Frequently Asked Questions
How much capital do I need to apply the 1% rule meaningfully?
The math works at any account size, but practical floors apply. With $1,000, 1% risk is $10 per trade — which is small enough that exchange minimums (typically $5-10 minimum order) and fees (0.1-0.4% taker fees) become significant frictions. $5,000-10,000 is the practical starting range where the math runs cleanly. Below that, paper-trade the methodology for three months before sizing up; the discipline matters more than the dollars at first.
When can I move from 1% risk to 1.5% or 2%?
After at least 12 months of consistent journaling and a measured expectancy of +0.2R or higher across at least 100 trades. Even then, scale by 0.25% increments and reassess after another 50 trades. Most traders never need to scale above 1%; the additional return from sizing up is small compared to the survival cost if expectancy estimates were wrong.
Should I use a mental stop or a hard stop on the exchange?
Default to a hard stop on the exchange. Mental stops fail for the same reason that diet plans fail at midnight — discipline degrades when emotion peaks, and emotion peaks exactly when a stop should trigger. The only defensible reasons for a mental stop are: an extremely illiquid pair where the hard stop would slip badly, or a known stop-hunt environment where you place the stop further away mentally than you would on the exchange. Both cases require explicit journal justification.
When does leverage make sense in risk management terms?
Leverage doesn’t change the position-sizing math directly — your dollar risk per trade should still be 1% of equity regardless of leverage. What leverage does is enlarge your effective position size for a given dollar risk, which only matters if your stops are tight enough that 1% risk on no leverage produces a position too small to be meaningful. For most beginners with $5,000-50,000 accounts and reasonable stops, leverage above 2-3x adds liquidation risk without proportionate benefit. Liquid staking and DeFi yield are often better capital-efficiency tools than leverage.
Can AI trading bots automate this risk methodology?
Reputable bot platforms can enforce position sizing and stop-loss rules — that part is easy to automate. What they cannot automate is judgment about stop placement (where structure invalidates the trade), correlation regime detection (when your “diversified” basket suddenly correlates), or expectancy reassessment after regime change. Treat bots as execution discipline, not strategic judgment. Our honest review of AI trading tools covers what 99% of bot pitches get wrong.
Putting It Together
Risk management in crypto is not a checklist of platitudes — it is a small set of formulas that, applied consistently, separate survival from blowup over thousands of trades. The 1% rule keeps you in the game. The position-sizing formula turns your risk percentage into actual order quantity. The stop-loss decision matrix matches the tool to the volatility regime. The R-multiple framework lets you measure whether your strategy has an edge. The drawdown asymmetry math reminds you why the first three rules matter.
Apply this consistently for three months and you will quietly outperform 80% of retail traders who are still arguing about which coin to buy. The picks rarely matter. The sizing always does.
Continue Learning
- Crypto Order Types Explained 2026 — the execution layer that runs underneath your stop-loss decisions
- Crypto Order Books and Market Depth — verify slippage at your stop level before sizing
- How to Read Crypto Charts — the structure that drives meaningful stop placement
- AI Crypto Trading 2026: Tools That Work — bot risk parameter selection done honestly
- AI Trading Bots Beginner Guide — automation of the risk rules in this article
- 7 Crypto Scam Patterns — “guaranteed returns” claims and why they violate risk math
- AML Score Drift — funds frozen as the unforeseen risk no stop-loss covers
Crypto educator and lead writer at ChainGain
Alex covers crypto execution, security, and the gap between marketing and operational reality. Former software engineer with 8 years in Web3 infrastructure including security audit work on automated trading systems and exchange API integrations. Full bio
This article is educational content, not financial advice. Crypto trading involves substantial risk of total loss. The math frameworks here describe how risk behaves; they do not guarantee any outcome. Past performance is not indicative of future returns. Consult a licensed financial advisor before making investment decisions. Sources: BIS Quarterly Review 2024 retail crypto participation analysis, ESMA MiFID II broker disclosures, Van K. Tharp R-multiple framework, CoinMarketCap Academy fractional Kelly analysis for crypto, TradingView ATR(14) indicator documentation, Kaiko liquidity research.