How to Read a Crypto Order Book: Market Depth Guide (2026)
Table of Contents
Affiliate disclosure: This is an educational guide. Exchange screenshots are referenced for visual learning only. We earn no commission on links to Margex, Bybit, or BloFin within this article.
Most beginner guides tell you the order book has bids and asks, then stop. That gets you to the starting line — but it doesn’t tell you when the wall you’re staring at is going to disappear, why your “tight” 0.3% spread isn’t actually tight, or which 30-40% of liquidity you’re not seeing. This guide picks up where our order types guide stopped and shows you how to actually use what the order book and depth chart show — including what they hide.
By the end you’ll have a four-tier framework for spread reading, four spoofing patterns to detect manipulation, three honest limits of order book data, and a beginner decision flow keyed to your portfolio size. Real Margex, Bybit, and BloFin examples appear throughout, but the goal is skill — not platform choice.
In This Guide
- What an Order Book Actually Shows You
- The Bid-Ask Spread: Four Tiers and What They Mean
- Reading the Depth Chart: Walls, Imbalance, and Cumulative Curves
- Spoofing & Manipulation: Four Patterns to Detect
- The Three Limits of Order Books Nobody Tells You
- A Beginner Decision Flow
- Real Exchange Examples
- How Order Book Reading Connects to Order Types and Tax
- Frequently Asked Questions
What an Order Book Actually Shows You
An order book is a live, two-sided ledger of every limit order resting on an exchange for a specific trading pair. Every centralized exchange — Binance, Bybit, Coinbase, Margex, BloFin — uses the same five-pillar layout, even though the colors and column orders differ slightly:
- Bid stack (buy orders, green by industry convention): sorted descending so the highest bid sits at the top.
- Ask stack (sell orders, red by industry convention): sorted ascending so the lowest ask sits at the top.
- Bid-ask spread: the gap between the best bid and the best ask. The single most important liquidity signal.
- Market depth: the cumulative size at each price level. Tells you how much volume the market can absorb without slippage.
- Order size: the quantity of a single order. Patterns of large or repeating orders reveal institutional intent.
The space between the best bid and best ask is where matching happens. A market order fills against the opposite stack and walks the price up or down through whatever depth exists. A limit order parks on its own side and waits. Our order types guide covers the mechanics; this guide is about reading the resting state of the book before you decide which order type to send.

How to Read the Bid-Ask Spread: Four Tiers and What They Mean
The bid-ask spread is your first signal. It tells you how much liquidity providers are charging you to trade now. When I first started reading order books, I used the same vague labels — “tight” or “wide” — until Kaiko’s depth methodology gave me something measurable. The institutional data provider measures depth at 0.1% and 1% bands, which gives us a defensible four-tier framework you can apply on any pair.
| Tier | Spread (% of mid-price) | Typical pairs | What it tells you | Order type to prefer |
|---|---|---|---|---|
| Tight | < 0.1% | BTC/USDT, ETH/USDT, top 5 spot | High-liquidity major pair, market makers competing aggressively | Market order is fine for retail size |
| Normal | 0.1% – 0.5% | SOL/USDT, AVAX/USDT, top-50 mid-caps | Healthy liquidity but slippage matters above ~$10K | Market for <$1K, limit at best bid/ask above |
| Wide | 0.5% – 1% | Small-cap altcoins, illiquid stable pairs | Limited market makers, slippage risk material | Limit only; expect partial fills |
| Extreme | > 1% | Micro-caps, post-listing dust, broken pairs | Market makers withdrew, exchange stress, or thin pair | Avoid — or accept that you’re the price discovery |
A practical habit: before sending any order, glance at the spread for two seconds and ask “compared to this pair’s normal.” A BTC/USDT spread of 0.3% on Binance during the US session is wide and signals stress. The same 0.3% on a small-cap altcoin during Asian hours is normal. Context beats absolute numbers.
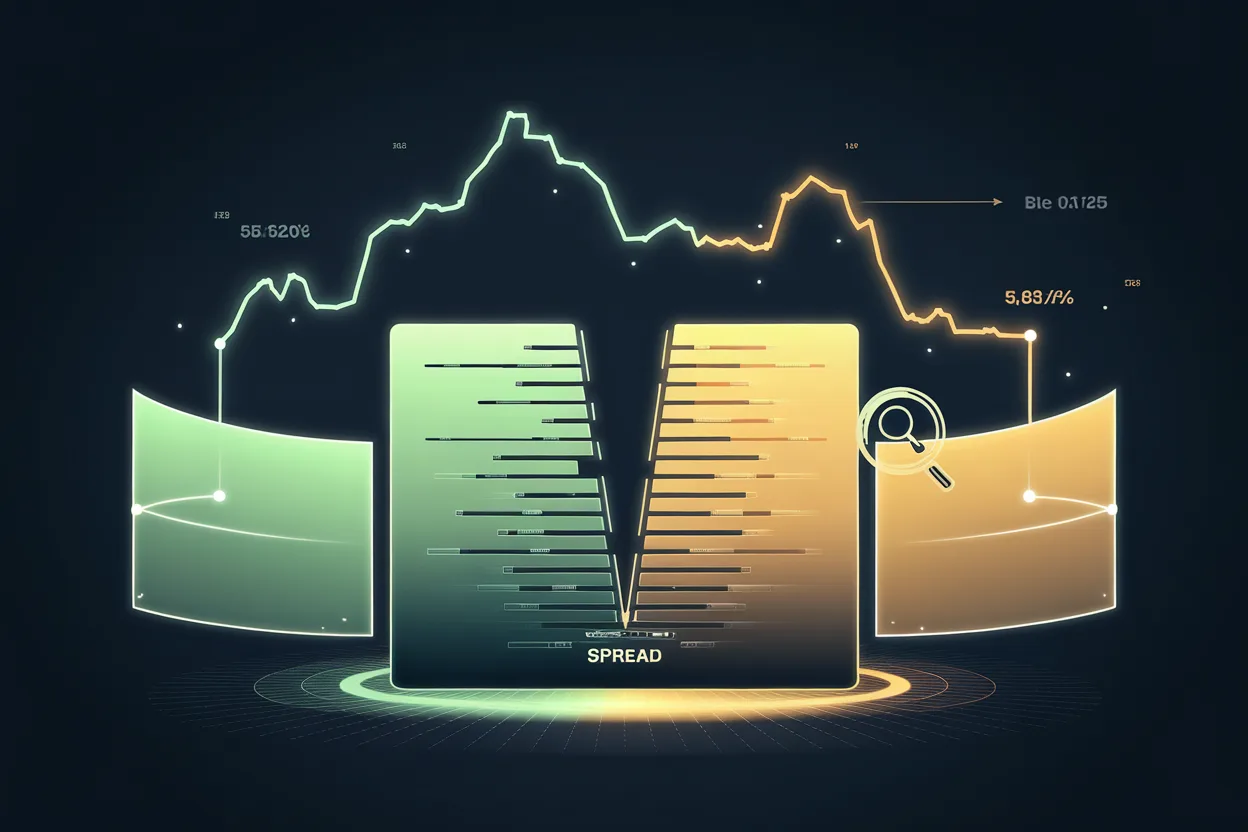
How to Read the Depth Chart: Walls, Imbalance, and Cumulative Curves
The depth chart is the order book turned sideways. The X-axis is price; the Y-axis is cumulative size. The green curve climbs as you walk down through bids; the red curve climbs as you walk up through asks. Three patterns matter:
- Steep curve = liquidity wall. A vertical jump means a large concentration of orders at one price. Walls absorb pressure — until they don’t.
- Flat curve = thin liquidity. A long horizontal section means sparse orders. Price can travel through it on small volume.
- Imbalance = directional pressure. Bid:ask cumulative ratio above ~1.5 leans bullish in the short term; below ~0.7 leans bearish. This is a tilt indicator, not a forecast.
Buy and sell walls are the most-discussed feature and the most-misread. A real wall — orders placed by a market maker who wants to actually fill — tends to fill incrementally as price approaches and stays in place even when price grazes it. A fake wall disappears the moment serious volume arrives. We’ll cover how to tell them apart in the next section.

Spoofing & Manipulation: Four Patterns to Detect
Order book manipulation is illegal in regulated futures markets and a grey-zone reality on many crypto venues. Spoofing was the basis of the 2020 JPMorgan settlement (~$920M) and the 2021 Citigroup case in TradFi metals; crypto-specific enforcement has been more limited but on-chain analysts have documented the same patterns extensively. Here are the four to watch:
| Pattern | What you see | Why it works | How to detect |
|---|---|---|---|
| 1. Disappearing wall | $1M+ wall appears on one side, vanishes within seconds when price approaches | Triggers retail traders into chasing the perceived support/resistance | Watch a 30-second window — real walls degrade gradually as fills occur, fake walls disappear in one tick |
| 2. Layering | Multiple stacked orders on the same side at descending sizes | Builds illusion of one-sided pressure to push price the other way | If five+ similarly-sized orders sit at suspiciously round prices and all cancel together, it’s layering |
| 3. Wash trading | Same size on both bid and ask that crosses repeatedly | Inflates volume metrics for ranking and listing eligibility | Recurring identical fills with no net price movement; on-chain analysts (e.g. Ki Young Ju, CryptoQuant) have flagged BTC/USD inverse perp pairs on multiple venues |
| 4. Iceberg orders | Apparent small order that keeps refilling at the same price | Hides true institutional size — legal, but you misjudge available liquidity | Watch for the same price level filling repeatedly with the same chunk size; depth never depletes as expected |
The honest takeaway: if a wall appears and disappears within seconds without filling, treat it as informational noise, not signal. Beginners commonly chase phantom walls right into a stop-loss. Our scam patterns guide covers other forms of crypto deception that overlap with order book manipulation.
The Three Limits of Order Books Nobody Tells You
The order book is a map. The actual market terrain is bigger and partly invisible. These three limits explain why spending hours wall-watching rarely beats simpler approaches for retail traders.
- Hidden liquidity. A meaningful share of crypto trading happens off-book — institutional OTC desks, dark pools on platforms like LMAX Digital, and iceberg orders that only display a small slice. Coalition Greenwich and Kaiko coverage suggests this fraction is substantial in mature markets, though crypto’s published figures vary widely. The order book you see is genuine, but not exhaustive.
- Manipulation risk. Spread and depth can be inflated by wash trading or distorted by spoofing. Regulated venues with surveillance (Coinbase, regulated US futures) have lower distortion than offshore perpetual swaps. Adjust your trust accordingly.
- Speed limits. Professional market makers achieve sub-millisecond exchange access via co-location (placing servers physically inside the exchange’s data centre). Retail web interfaces typically display order book updates with 100-250ms latency. I ran a side-by-side screen-capture comparison once: the wall I saw on my browser had already disappeared on the exchange’s co-location feed roughly 200ms earlier. By the time you see a wall, it has already lived in the eyes of HFTs for hundreds of milliseconds. Watching walls in real time as a retail trader is structurally a losing game.
None of this means the order book is useless. It means you should use it for what it’s good at — spread tier check, gross depth assessment, time-of-day liquidity context — and ignore what it’s bad at — predicting short-term price from individual walls.
A Beginner Decision Flow: Spread → Depth → Wall → Time
Here’s a four-step pre-trade checklist you can run in under a minute. The depth of the check should scale with your position size.
| Position size | Step 1: Spread | Step 2: Depth | Step 3: Walls | Step 4: Time of day |
|---|---|---|---|---|
| $100 – $1K | Tight or normal? Yes → market order OK | Skip | Skip | Skip |
| $1K – $10K | Tight or normal required | Confirm 10× your size at <0.5% slippage | Skip | Prefer 13:00-21:00 UTC |
| $10K – $100K | Tight required, normal acceptable for limit orders | Confirm 5-10× depth; consider iceberg or limit ladder | Watch for disappearing walls; wait if active | 13:00-21:00 UTC strongly preferred |
| $100K+ | Pair-by-pair baseline reading | Multi-venue depth aggregation | Active spoofing screen | Avoid Asian off-hours and weekend low-liquidity windows |
BTC and ETH typically show their tightest spreads during the 13:00-21:00 UTC window when US and EU desks overlap. The 02:00-06:00 UTC window — Asia overnight — historically sees wider spreads and thinner depth on most pairs. This isn’t a forecast; it’s a liquidity heatmap. Combine this with TA fundamentals for entries that respect both signal and execution quality.
Real Exchange Examples: Margex, Bybit, BloFin
Each exchange’s interface looks slightly different, but the same five pillars apply. In my own walk-through across Margex and Bybit during the London/NY overlap, the examples below reflect what you’d actually see during normal market conditions; numbers are illustrative because real spreads change second to second.
- Margex BTC/USDT perpetual: Order book on the right edge, depth chart toggleable. A typical reading might show best bid 67,142.5 and best ask 67,143.0 — a 0.5 USD spread, about 0.0007%, firmly tight tier. Cumulative depth on each side runs into hundreds of thousands of dollars within 0.1% of mid-price.
- Bybit BTC/USDT spot: Order book on the left side of the trading panel. Bybit’s depth visualizer shades order density behind the rows; deeper shading = larger size. Watch the leftmost cumulative column — that’s your real-time depth read without switching to the chart view.
- BloFin SOL/USDT perpetual: A normal mid-cap pair with a typical spread around 0.08-0.15% during US hours, widening to 0.3%+ during Asian off-hours. The depth chart shows visible asymmetry depending on funding rate direction; persistent buy-side imbalance often coincides with positive funding paying longs.
The pattern across exchanges: tight spreads on the top 5-10 pairs, normal-to-wide spreads on everything below the top 50, and dramatic widening on perp futures when funding rates flip aggressively. Learn one exchange’s layout deeply rather than skimming five — pattern recognition is what makes this fast.
How Order Book Reading Connects to Order Types and Tax
Reading the book is not a standalone skill. It feeds three downstream decisions.
- Order type selection: Tight spread → market order is acceptable. Wide spread → limit order at best bid or ask. Wall risk on a stop-loss → consider stop-limit instead of stop-market to avoid fills inside a fake-wall trap. Cross-reference our order types guide.
- LST depeg detection: Liquid staking tokens like stETH and cbETH normally trade in tight spreads on Curve and centralized venues. Spread expansion was visible in the days preceding the June 2022 stETH stress event when the token traded as low as ~7% below ETH. Our liquid staking guide covers the structural risks behind those moves.
- Tax tracking: Every fill is a taxable event in most jurisdictions. A series of small limit fills creates more tax records than one market order — convenient for execution, painful for accounting. AI-powered tax tools handle multi-fill orders well; they struggle with cross-venue rebates and proprietary instrument types. Our AI crypto tax guide covers what those tools can and can’t do.
Bots, including market-making and grid bots, run almost entirely on order book state. Our trading bot guide explains why bot performance is so dependent on order book quality and why bots struggle on illiquid pairs even when their strategy looks good in backtests.
Frequently Asked Questions
Is the order book the same as the trade history?
No. The order book shows resting limit orders that haven’t filled yet. Trade history shows executions — fills that already happened. The book is forward-looking liquidity; the history is past activity. Reading both gives you intent and outcome together.
How do I know if a buy wall is real or spoofing?
Watch it for 30-60 seconds. Real walls degrade gradually as fills occur and stay in place when price drifts toward them. Spoofed walls vanish in one tick the moment serious volume arrives. If a wall sits unchanged through several minutes of price action, it’s more likely real. If it appears and disappears with no fills, it’s a signal someone is trying to influence you.
Should beginners actively trade off the depth chart?
For most beginners, no. The depth chart is excellent for pre-trade liquidity check (will my order fill cleanly?) but poor for short-term price prediction (where will price go in the next 5 minutes?). Use it to validate your execution, not as a primary signal. The 100-250ms display lag versus HFT firms makes wall-chasing structurally unfavorable.
Why do some orders never appear in the order book?
Iceberg orders show only a small visible slice. OTC desks and institutional dark venues match trades entirely off-book. Some exchanges aggregate retail orders into bundled flow that prints differently. The displayed book is a representative slice of liquidity, not the totality.
Which exchange has the best order book interface for learning?
Pick one with deep liquidity on the pair you trade — that gives you a useful benchmark for “normal.” Coinbase and Bybit have clean entry-level interfaces. Margex shows depth alongside the order book by default. Whichever you choose, learn it deeply before adding a second venue. Pattern recognition gets faster with familiarity.
Putting It Together
The order book is one of the most powerful free tools in crypto trading — and one of the most misused. The skill is not to predict price from walls. The skill is to evaluate execution quality before you commit, recognize when manipulation is happening, and accept the limits of what retail-side data can tell you.
The four-step decision flow scales to your size. The four spoofing patterns protect you from chasing phantoms. The three honest limits keep your expectations calibrated. Apply these consistently for thirty days and your fills will quietly improve while everyone else is still arguing about whether a wall is real.
Continue Learning
- Crypto Order Types Explained 2026 — pair this guide’s spread reading with order type selection
- How to Read Crypto Charts — combine depth analysis with technical analysis
- AI Crypto Trading Bots — bots run on order book state; this is why they fail on illiquid pairs
- Liquid Staking 2026 — stETH spread expansion as a depeg early warning
- AI Crypto Tax 2026 — every fill is a taxable event; multi-fill orders complicate accounting
- 7 Crypto Scam Patterns — order book manipulation is one piece of broader market deception
- Crypto Glossary — bid, ask, spread, depth, taker, maker defined
This article is educational content, not financial advice. Crypto trading involves substantial risk. Order book reading is one input among many; past patterns do not guarantee future behavior. Consult a licensed advisor before making investment decisions. Sources: Kaiko liquidity research, AmberData market microstructure analysis, Coalition Greenwich market structure surveys, Coinbase and Bybit incident post-mortems, Nansen on-chain forensics.
Part of ChainGain’s CEX vs DEX vs Hybrid Exchanges 2026: The Complete Comparison guide series.