How to Read Crypto Charts: Technical Analysis for Beginners (2026)
Table of Contents
This article may contain links to partner platforms. We may earn a commission at no extra cost to you. Editorial Policy
I spent my first six months trading crypto without understanding a single chart pattern — and lost $800 because of it. Learning how to read crypto charts changed everything. I’d buy because someone on Twitter said “BTC is going up,” and sell the moment a red candle appeared. Once I learned the basics of technical analysis, my decision-making improved dramatically. I stopped panic-selling dips and started recognizing patterns that repeated themselves week after week.
This guide teaches you everything I wish I’d known on day one. We’ll cover candlestick charts, the most useful indicators, support and resistance, volume, and a simple strategy you can start using today — all explained for complete beginners. No math degree required.
What Is Technical Analysis?
Technical analysis (TA) is the practice of studying historical price data and trading volume to identify patterns and predict future price movements. Unlike fundamental analysis, which examines a project’s technology, team, and real-world utility, TA focuses entirely on what the chart is telling you.
Think of it this way: fundamental analysis asks “Is this asset worth buying?” while technical analysis asks “Is now a good time to buy it?”
A few things to understand upfront:
- TA is not fortune-telling. It’s a probability tool. A bullish pattern doesn’t guarantee the price will go up — it tells you the odds favor an upward move based on historical behavior.
- It works partly because enough traders use the same signals. When thousands of traders see the same support level or indicator crossover, they act on it simultaneously — creating a self-fulfilling prophecy. This is documented in academic research on market reflexivity.
- Crypto-specific volatility matters. Bitcoin’s annualized volatility sits around 75%, compared to roughly 15–20% for the S&P 500 (source: Fidelity Digital Assets). That means TA signals can play out faster and more violently in crypto. A breakout that takes weeks in stocks might happen in hours with Bitcoin.
- The market never sleeps. Unlike stocks (Mon–Fri, limited hours), crypto trades 24/7/365. There are no opening bells, no closing auctions, and no weekend gaps. This continuous data stream makes TA particularly useful for crypto traders.
In my experience, TA doesn’t replace thinking — it structures it. Instead of guessing, you have a framework for making decisions. That alone makes it worth learning.
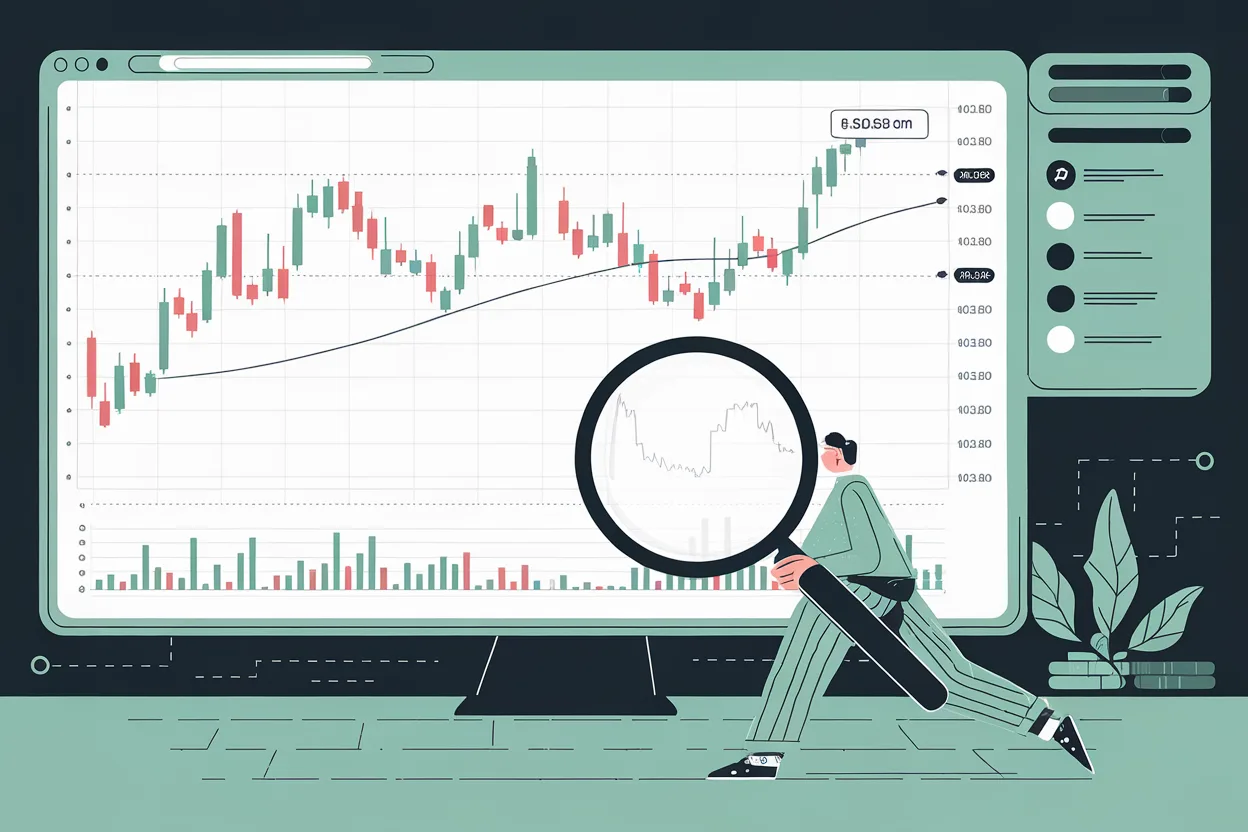
Understanding Candlestick Charts

Candlestick charts are the most widely used chart type in crypto trading. They pack four data points into a single visual element, making it easy to read price action at a glance.
A Brief History
Candlestick charting has roots in 18th-century Japan, where rice traders developed visual methods to track price movements. The technique is often attributed to Munehisa Homma (1724–1803), a legendary rice trader from Sakata, though historians debate the specifics. Japanese candlestick methods were formalized in the late 1800s and introduced to Western markets by Steve Nison in his 1991 book Japanese Candlestick Charting Techniques.
How Candlesticks Work
Each candlestick represents a specific time period (1 minute, 1 hour, 1 day, etc.) and contains four pieces of information:
| Component | What It Shows | Visual Position |
|---|---|---|
| Open | Price at the start of the period | Bottom of body (bullish) / Top of body (bearish) |
| Close | Price at the end of the period | Top of body (bullish) / Bottom of body (bearish) |
| High | Highest price during the period | Top of upper wick (shadow) |
| Low | Lowest price during the period | Bottom of lower wick (shadow) |
| Body | Range between open and close | Filled/colored rectangle |
| Wicks (Shadows) | Price extremes beyond open/close | Thin lines above and below the body |
- Green (bullish) candle: Close is higher than open — buyers were in control during this period.
- Red (bearish) candle: Close is lower than open — sellers dominated.
- Long body: Strong conviction in that direction.
- Short body: Indecision or low momentum.
- Long upper wick: Price was pushed up but sellers drove it back down.
- Long lower wick: Price was pushed down but buyers drove it back up.
5 Essential Candlestick Patterns
Hundreds of candlestick patterns exist, but you only need to know a handful to get started. Here are the five most useful patterns for crypto beginners:
1. Doji — Indecision, Potential Reversal
A Doji forms when the open and close prices are virtually identical, creating a cross or plus shape. It signals that neither buyers nor sellers won the period. On its own, a Doji has roughly a 48% success rate as a reversal signal — which is essentially a coin flip. But when it appears at a key support or resistance level with volume confirmation, its reliability increases significantly.
2. Hammer — Bullish Reversal at Support
A Hammer has a small body at the top and a long lower wick (at least 2x the body length). It appears during downtrends and signals that sellers pushed the price down, but buyers stepped in aggressively. With volume confirmation, Hammers have a 60–70% success rate for indicating bullish reversals.
3. Engulfing — Strong Reversal Signal
A Bullish Engulfing pattern occurs when a green candle’s body completely covers the previous red candle’s body. The bearish version is the opposite. This pattern is most reliable when accompanied by 2–3x average volume, as the increased participation confirms the shift in sentiment.
4. Morning Star / Evening Star — Three-Candle Reversal
The Morning Star is a three-candle bullish reversal: a long red candle, followed by a small-bodied candle (the “star”), followed by a long green candle. The Evening Star is its bearish mirror image. These patterns are among the most reliable reversal signals because they show a clear shift in momentum over three periods.
5. Shooting Star — Bearish Reversal at Resistance
A Shooting Star has a small body at the bottom and a long upper wick. It appears during uptrends and signals that buyers pushed the price up, but sellers rejected the higher level. It’s the inverse of a Hammer and works best when confirmed by declining volume on the following candle.
Important
No pattern works in isolation. Always confirm with volume and at least one other indicator before making a trading decision. A Hammer at a support level with high volume is far more meaningful than a Hammer in the middle of nowhere with low volume.
Volume — The Hidden Signal
If price tells you what the market is doing, volume tells you how seriously. Volume measures the number of units traded during a given period. It’s often displayed as a bar chart beneath the candlestick chart.
Here are the core volume-price rules every beginner should internalize:
- High volume confirms moves. A breakout above resistance on high volume is likely genuine. The increased participation shows that many traders agree with the new direction.
- Low volume warns of fake breakouts. If the price breaks a key level but volume is below average, be skeptical. Without conviction from traders, the move is more likely to reverse.
- Volume spikes at turning points. Capitulation selling (massive volume at a bottom) and euphoric buying (massive volume at a top) often mark reversals.
- Declining volume during a trend is a warning. If the price keeps rising but volume is shrinking, the trend is losing steam.
I now check volume before every trade. It’s saved me from countless fake breakouts — especially with altcoins, where low liquidity makes manipulation easier.
Volume Indicators

OBV (On-Balance Volume)
OBV is a cumulative indicator that adds volume on up days and subtracts it on down days. It was developed by Joseph Granville in 1963. The idea is simple: volume precedes price. If OBV is rising while the price is flat, accumulation is happening beneath the surface — a potentially bullish sign. If OBV is falling while the price is flat, distribution may be underway.
VWAP (Volume-Weighted Average Price)
VWAP calculates the average price weighted by volume throughout the trading session. It’s primarily used as an intraday indicator. When the price is above VWAP, the market has bullish sentiment; below VWAP, bearish. Many institutional traders use VWAP as a benchmark, making it an effective dynamic support/resistance level.
Support and Resistance — Where Price Bounces
Support and resistance are perhaps the most fundamental concepts in technical analysis.
Support is a price level where buying pressure tends to prevent further decline — think of it as a floor. When the price approaches support, buyers see it as a bargain and step in, pushing the price back up.
Resistance is a price level where selling pressure tends to prevent further advance — a ceiling. When the price approaches resistance, sellers take profits or open short positions, pushing the price back down.
How to Identify Support and Resistance
- Previous highs and lows: A price level where the market previously reversed is likely to act as support or resistance again. The more times a level is tested, the stronger it becomes.
- Round numbers: Psychological levels like $50,000 or $100,000 for Bitcoin attract orders. Studies show that over 70% of retail traders cluster limit orders around round numbers, creating natural S/R zones.
- Moving averages: The 50-day and 200-day moving averages often act as dynamic support/resistance (more on these below).
- Volume profile: Price levels where a lot of historical volume was traded tend to act as magnets for future price action.
Role Reversal
One of the most reliable principles in TA: when support breaks, it becomes resistance, and when resistance breaks, it becomes support. This happens because traders who bought at the support level are now underwater and looking to sell at breakeven when the price returns to that level.
| Step | Action | What to Look For |
|---|---|---|
| 1 | Find previous highs/lows | At least 2–3 touches at the same level |
| 2 | Mark round numbers | $10K, $25K, $50K, $100K for BTC |
| 3 | Add moving averages | 50 SMA and 200 SMA on daily chart |
| 4 | Watch for role reversal | Old support tested as new resistance (or vice versa) |
| 5 | Confirm with volume | High volume at the level = strong S/R |
4 Essential Indicators for Beginners
Indicators are mathematical calculations applied to price and volume data. Thousands exist, but you only need a few to build a solid foundation. Here are the four I recommend every beginner learns first.
RSI (Relative Strength Index)
The Relative Strength Index was created by J. Welles Wilder Jr. in 1978 and remains one of the most widely used momentum oscillators.
- Scale: 0–100
- Overbought zone: Above 70 — the asset may be overvalued and due for a pullback
- Oversold zone: Below 30 — the asset may be undervalued and due for a bounce
- RSI divergence: When the price makes a new high but RSI makes a lower high, it signals weakening momentum and a potential reversal. This is one of the most powerful signals in TA.
- Best for: Identifying overbought/oversold conditions and momentum divergences
In my experience, RSI works best on the daily timeframe for crypto. On lower timeframes, Bitcoin can stay overbought for days during strong trends, making the signal less useful.
MACD (Moving Average Convergence Divergence)
MACD was created by Gerald Appel in 1979 and is widely used for trend and momentum analysis.
- MACD line: 12-period EMA minus 26-period EMA
- Signal line: 9-period EMA of the MACD line
- Histogram: Visual representation of the distance between MACD and signal line
- Bullish signal: MACD crosses above the signal line
- Bearish signal: MACD crosses below the signal line
- Best for: Identifying trend direction and momentum shifts
The MACD is slower than RSI but better at confirming sustained trends. I use it as a secondary confirmation — if RSI says oversold and MACD is about to cross bullish, that’s a stronger signal than either alone.
Moving Averages (SMA & EMA)
Moving averages smooth out price data to reveal the underlying trend.
- SMA (Simple Moving Average): Gives equal weight to all periods. Smoother but lags more. Example: 200-day SMA = average of the last 200 closing prices.
- EMA (Exponential Moving Average): Gives more weight to recent prices. Responds faster to new data but produces more false signals.
Key periods to watch:
| Period | Type | Used For |
|---|---|---|
| 20 | Short-term | Recent price trend, Bollinger Band center |
| 50 | Medium-term | Swing trading, Golden/Death Cross component |
| 200 | Long-term | Major trend direction, institutional reference |
Golden Cross: When the 50-day moving average crosses above the 200-day moving average, it’s considered a bullish signal. Historically, Bitcoin has rallied an average of 50%+ in the 6 months following a Golden Cross.
Death Cross: The opposite — the 50-day crosses below the 200-day, signaling potential bearish momentum. However, in crypto, Death Crosses have a mixed track record and sometimes coincide with the end of a correction rather than the start of one.
Bollinger Bands
Bollinger Bands were created by John Bollinger in the 1980s and measure volatility relative to a moving average.
- Middle band: 20-period SMA
- Upper band: Middle band + 2 standard deviations
- Lower band: Middle band − 2 standard deviations
- Price near upper band: Potentially overbought, may pull back
- Price near lower band: Potentially oversold, may bounce
- Band squeeze: When the bands narrow, volatility is low and a breakout is likely coming. This is one of the most actionable signals in crypto — I actively watch for Bollinger squeezes on the daily chart.
- Best for: Volatility assessment and identifying potential breakouts
Choosing the Right Timeframe
The timeframe you trade on fundamentally affects what you see. A 1-minute chart can look bearish while the daily chart is firmly bullish. Choosing the right timeframe depends on your trading style and goals.
| Timeframe | Trading Style | Best For | Noise Level |
|---|---|---|---|
| 1–5 min | Scalping | Quick profits, experienced traders | Very High |
| 15–60 min | Day trading | Intraday trends, active monitoring | High |
| 4h | Swing trading | Multi-day moves, moderate time commitment | Medium |
| 1D | Position trading | Major trends, less screen time | Low |
| 1W | Investing | Long-term direction, macro trends | Very Low |
Recommendation
Start with the daily (1D) chart. It filters most noise while showing meaningful trends. Once you’re comfortable reading the daily chart, you can zoom into the 4-hour chart for more precise entries and exits. Avoid 1-minute charts until you have at least 6 months of experience — the noise will generate false signals and erode your confidence.
Free Charting Tools
You don’t need to spend money to get started with technical analysis. Several free tools offer more than enough features for beginners.
| Tool | Best For | Key Features | Limitations |
|---|---|---|---|
| TradingView | Best overall | 400+ indicators, community scripts, alerts, social features | Free tier: 2–3 indicators per chart |
| CoinGecko | Quick research | Coin comparison, DEX tracking, token metrics | Limited TA tools |
| Binance | Exchange trading | Beginner/advanced chart modes, integrated trading | Only Binance trading pairs |
| Bybit | Advanced traders | TradingView integration, 110+ drawing tools | Steeper learning curve |
TradingView is what I use daily. The free tier is sufficient for learning — you can add up to 3 indicators per chart, which is actually a good constraint for beginners (it forces you to focus on what matters). Once you can read charts confidently, you’re ready to buy your first cryptocurrency.
5 Mistakes That Cost Beginners Money
I’ve made most of these mistakes myself, and I’ve watched other traders repeat them. Learning to avoid these common errors will save you more money than any indicator.
- Relying on one indicator. No single indicator is reliable enough to trade on alone. Use 2–3 together for confirmation. RSI says oversold? Check if volume confirms it and if the price is near a support level.
- Ignoring volume. A breakout without volume is often fake. I can’t overstate this — volume is the single most underappreciated tool by beginners. If you take one thing from this article, let it be: always check volume.
- Using too short a timeframe. One-minute charts are mostly noise for anyone who isn’t a professional scalper. Stick to daily or 4-hour charts until you’ve built solid pattern recognition skills.
- Confirmation bias. Seeing patterns that aren’t there because you want them to be. If you’re long Bitcoin, every formation looks like a bull flag. Combat this by asking: “What would a bear see on this chart?”
- Not setting stop-losses. Bitcoin dropped over 30% in a single day in May 2021. Without a stop-loss, you’re exposed to catastrophic moves. Always define your maximum acceptable loss before entering a trade — 1–2% of your portfolio per trade is a common risk management rule.
Putting It All Together — A Simple Beginner Strategy
Here’s a straightforward framework that combines everything we’ve covered. It uses the daily chart and requires only 15–20 minutes of analysis per day.
- Check the trend. Look at the 200-day SMA direction. Is the price above it (bullish) or below it (bearish)? Only take trades in the direction of the major trend.
- Identify support and resistance zones. Mark the nearest significant levels using previous highs/lows and round numbers.
- Wait for a candlestick pattern near S/R. Look for a Hammer, Engulfing, or Morning Star at a support zone (for buys) or a Shooting Star or Evening Star at resistance (for sells).
- Confirm with volume and RSI. Volume should be above average on the signal candle. RSI should support the direction (below 40 for bullish reversals, above 60 for bearish).
- Set your entry, stop-loss, and target. Enter after the signal candle closes. Place your stop-loss below the recent swing low (for buys) or above the recent swing high (for sells). Risk no more than 1–2% of your portfolio. Target at least a 2:1 reward-to-risk ratio.
- Execute and don’t second-guess. Once you’ve placed the trade with defined risk, let it play out. Don’t move your stop-loss further away, and don’t exit early because of a single red candle.
This simple framework is what I use for about 80% of my trades. It won’t win every time — no strategy does — but it keeps emotions out of the equation and gives you a repeatable, rational process for making decisions.
Crypto vs Stocks — TA Differences
If you’re coming from stock trading, crypto charts will feel familiar but behave differently. Here are the key distinctions:
| Factor | Crypto | Stocks |
|---|---|---|
| Market hours | 24/7/365 | Mon–Fri, limited hours |
| Volatility | BTC ~75% annualized | S&P 500 ~15–20% |
| Manipulation risk | Higher (especially low-cap coins) | Lower (more regulation) |
| News impact | Extreme and instant | Moderated by pre/post-market |
| Weekend gaps | None — continuous trading | Common on Monday open |
| Liquidity | Varies widely by coin | Generally deep for large caps |
| Circuit breakers | None — unlimited moves | Yes — trading halts on extreme moves |
The lack of circuit breakers in crypto is significant. In traditional markets, a 7% drop triggers a trading halt. In crypto, nothing stops a 30% crash from happening in minutes. This is why stop-losses and position sizing matter even more in crypto than in stocks — and why, if you ever trade with borrowed funds, you need to understand leverage, margin & liquidation before a sudden move wipes out your position.
Frequently Asked Questions
Can you predict crypto prices with technical analysis?
No, and anyone who claims they can is misleading you. Technical analysis identifies probabilities based on historical patterns — it doesn’t predict the future with certainty. A pattern that has worked 65% of the time historically still fails 35% of the time. The goal isn’t to be right on every trade; it’s to have a consistent edge over many trades.
Which indicator is the most accurate for crypto?
No single indicator is the “most accurate.” Each measures something different: RSI measures momentum, MACD measures trend direction, Bollinger Bands measure volatility. The most effective approach is combining 2–3 indicators that complement each other. Based on my experience, RSI combined with volume analysis provides the best foundation for beginners.
How long does it take to learn technical analysis?
You can learn the basics in a few weeks of dedicated study. Understanding candlestick patterns, support/resistance, and a couple of indicators is achievable in 2–4 weeks. However, developing the pattern recognition and emotional discipline to apply TA consistently takes 3–6 months of practice. Start with a demo account or very small positions while you build experience.
Is technical analysis enough, or do I need fundamental analysis too?
For best results, use both. Technical analysis tells you when to enter or exit a trade, while fundamental analysis tells you what is worth trading. Many successful crypto traders use fundamentals to build a watchlist of strong projects and TA to time their entries and exits. For educational resources on fundamental research, see our guide on what cryptocurrency is and how it works.
What’s the best free charting tool for crypto beginners?
TradingView is the best free option by a significant margin. Its free tier includes real-time data, hundreds of indicators, community-built scripts, and an intuitive interface. The only meaningful limitation is the number of indicators you can add per chart (2–3 on the free plan), which is actually enough for beginners. CoinGecko is a useful complement for quick price checks and fundamental data.
Continue Learning
Related Guides on ChainGain
- What Is Cryptocurrency? Complete Beginner’s Guide — Start here if you’re new to crypto
- How Blockchain Works: The Technology Behind Crypto — Understand the infrastructure
- How to Buy Your First Cryptocurrency — Ready to buy? Start here
- Crypto Passive Income: Staking, Lending & Yield (2026) — Earn while you hold
- Cryptocurrency Security: How to Protect Your Assets — Keep your crypto safe
Disclaimer: This guide is for educational purposes only and does not constitute financial or investment advice. Technical analysis does not guarantee profits. Cryptocurrency markets are highly volatile and you can lose your entire investment. Always do your own research and never invest more than you can afford to lose.
The Complete Crypto Trading Guide Series
Our crypto trading and analysis guides:
- P2P Crypto Trading: 7 Scam Types and How to Stay Safe (2026)
- AI Crypto Trading Bots 2026: Honest Beginner’s Guide — What Works, What Doesn’t, and the 5 Risks Nobody Tells You
- Crypto Order Types Explained 2026: Market vs Limit vs Stop-Loss
- Crypto Risk Management 2026: Position Sizing, Stop-Loss & R-Multiples for Beginners